Being a Human Factors/Usability professional, I’m often asked how to select cities for user research.
With market research, studies are often large and encompass a number of geographic regions in order to get a statistically significant sample. The focus is on what features a product should have and what will motivate people to buy the product.
With user research, however, it’s a bit different. At Farm we select cities based on the type of research we’re doing and the factors that influence how people use the product or device that we’re designing. We need these inputs in order to implement the required features in a way that will provide a satisfying (and safe) user experience.
The first thing we look at is the type of research—is it generative field research to identify user needs or areas for innovation, or formative testing of prototypes in order to get design feedback?
With generative research, such as interviews and observations, regional differences are more likely to occur because we are looking at patterns of behaviors, expectations, and opinions.
With usability testing, geographic location tends to be less of an issue, because if a product is poorly designed, users will have problems regardless of where they’re located. (Preference testing of multiple design concepts is sort of a hybrid of generative research and formative testing, because we’re still generating design inputs, but the goal is to down select to a preferred design.) By understanding the type of research being performed, we can select cities that best meet our objectives.
Next we work with our client to understand the target market segmentation. Once we understand the market in broad terms, we ask ourselves what factors might make a difference when using this particular product or device.
For example, with medical instruments the user’s clinical specialty, type of hospital, and hospital department are usually high on the list. We might also think about factors such as years of experience using the product, experience with similar products, gender, training, cultural background, or level of physical ability.
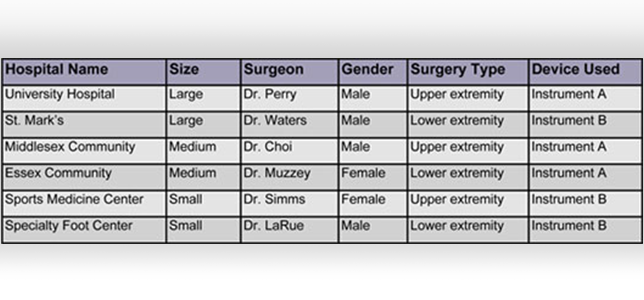
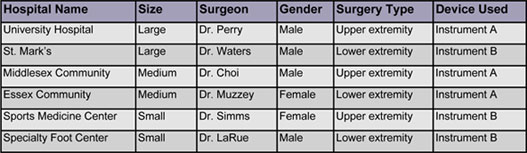
Once we’ve identified the attributes affecting product usage, we create an attribute map that shows the attributes and the range of values (and therefore subgroups) for each attribute. The table below shows a fictitious example for an X-ray imaging device used in orthopedic surgery. (Here I’m assuming that the client has told us there are strong regional differences in how people interact with the product.)

Often, for practical reasons, we can’t include users that represent all of the attribute combinations, so we have to prioritize or assume correlations between some of the attributes.
For example, in this case we might assume that large hospitals have the largest operating rooms (not always true, by the way!), or we might assume that we will see a variety of OR sizes given the other attribute variations. Similarly, we may determine that experience level is not very important, or that as long as we include some male and some female surgeons, it doesn’t matter where they practice.
Based on that analysis, the next step is to create a research map, like the one shown below.

In this example, we end up with eighteen sites that we’d like to visit. If time and budget constraints allow, we will try to visit them all. If not, we will again have to prioritize.
I should add that there are times when we think that geographic location won’t influence the results of the research, but our clients want to expand the sample anyway.
For example, the client may have market research activities already planned in four regions, so it makes sense to piggy-back on the investment already made. Or, there may be political reasons for wanting to include certain countries in order to get buy-in from regional managers.
The final city selection within each region involves considerations such as travel expenses, labor costs, and expedience. If the research team is located on the East Coast, then the cost of travel will be lower if the target cities are also in the east. Then, among eastern cities, there’s a big variation in travel expenses such as meals and hotels. Conducting research in Hartford, CT, for example, is cheaper than conducting research in New York City.
The final factor to consider is expedience. If our client has a facility in Denver that we can use to run a usability test, then we might choose Denver over another western city. Or, if we’ve used a market research facility in Indianapolis and had a good experience, then we might select Indianapolis over another similar city, other factors being equal.
Using our example, the final research schedule for Region 1 might look like the table below. With this schedule, we will see a good range of user types, usability challenges, environments, and differences in workflow. We’ve also stayed within our time and budget constraints, and set the stage to develop a robust set of user requirements and design inputs.
If you have comments, suggestions, or specific questions, please feel free to comment!