The words “Design of Experiments (DOE)” and “Taguchi” usually conjure up images of cell phones coming off the manufacturing line while someone inspects them for defects. The intended application for DOE is in the manufacturing world, so it’s easy to see why the product design community often neglects these methodologies. However, my experience implementing DOE into product design shows otherwise. Using screening designs, where applicable, can save design firms (and the harried engineers doing endless testing) time, money, and resources.
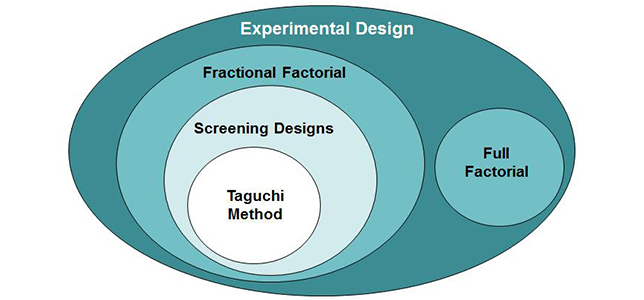
A DOE is loosely defined as purposeful change to the inputs of a process to observe change in the outputs. Whether we choose a fractional factorial or a full factorial does not change the fact that we are using DOE, unless we are picking a method without being mindful of the advantages and disadvantages of our selection. The image below illustrates the relationship among DOE (also referred to as Experimental Design), screening designs, and the Taguchi method. The Taguchi method is a type of screening design, which is a type of fractional factorial, which falls under the umbrella of DOE along with full factorial.
Becoming an expert in Design of Experiments often requires entire courses, poring over textbooks devoted to the subject, and spending hundreds of hours on real-world experimental design and analyses. A little bit of linear algebra helps as well. The advantage of Taguchi screening designs is that they provide a taste of the subject without requiring a degree in statistics. Engineers can access standard tables and available software, and become “experts” in screening designs over the course of a few hours.
Types of projects in the product design world that might be good candidates for a screening design include:
- A product that is not meeting expected performance results
- A large number of concepts that need to be narrowed down to a few
Popular Experimental Design Methods
How many of us have gone into the lab only to return with more questions than answers? Mechanical engineers like me, who are not usually trained in statistical analysis, tend to employ one of two experimental methods: full factorial or one-variable-at-a-time. Full factorial involves testing every combination of variables in a separate test configuration. The output is a model that theoretically describes the behavior of the system. How often do clients ask for a complete mathematical model of their system? More often than not, the client just wants to make it work. One-variable-at-a-time involves performing one test, looking at the results, and then designing the next test based off those results. The idea is that each test will point you in the direction of the optimized solution. However, this type of testing can often lead to numerous tests with conflicting information and no quantitative numbers to back up observations. A screening design provides the best of both of these methods; it points to the optimal solution with minimal test setups. If a more precise output is preferred, a full factorial can be run with more thoughtful, and ideally less, main factors.
Overview of Screening Designs
Screening designs introduced by Genichi Taguchi replace traditional full factorial configurations with a fraction of the tests by sacrificing information about interactions among main factors. Usually consisting of eight, 16, or 27 separate orthogonal configurations, depending on the number of design variables, screening designs point to the optimal discrete setting of each main factor tested. This means that screening designs largely neglect interactions among main factors. For example, if you were to run an experiment testing seven variables at max./min. values, for a full factorial you would run 128 different configurations. A Taguchi screening design calls for eight. If the screening design eliminates two factors from being important, your full factorial count suddenly drops to 32, with just the addition of eight preliminary tests.
In one case we implemented a Taguchi screening design to simultaneously reduce testing time and improve performance in an environment with a high degree of noise. Noise is a factor that affects performance but that we have little control over, like swings in ambient temperature, machining tolerances, or in this case, differences in technique from surgeon to surgeon. Our client had a bench-top surgical device that was operating well in the lab but had sporadic performance in the surgical suite.
We identified five main factors on the device we were able to change (design variables) and two noise variables that accounted for most of the variation we observed. We were able to pare down four of the factor options to two or three levels: either a max./min. for continuous factors or a discrete setting for qualitative variables. Our qualitative variables were three swappable blade geometries, each coming in two different sizes. Because none of these can be interpolated between, they are defined as discrete.
With a full understanding of the design variables and noise variables, we debated doing a full factorial versus a Taguchi screening design. A full factorial would have required 2 x 2 x 2 x 2 x 3 = 48 separate test setups neglecting noise and 48 x 2 (levels for noise variable one) x 2 (levels for noise variable two) = 192 separate test setups with noise included (total testing time would be about 28 days). A Taguchi L18 required 18 test setups x 4 runs for each setup to account for noise = 72 tests (total time would be about 5 days). This means that we only perform the test setup, the most time-consuming portion of the test, 18 times, and run four samples through each setup. The Taguchi L18 was the clear winner because of the balance of information about noise and time savings. The Taguchi method would not have been a good choice if our output, system performance, was a nominal target rather than a minimizing or maximizing target, or if the factors had not been independent from one another.
After running 18 separate configurations, the output is an indication of what factor settings lead to an optimized system performance. Below is a commonly used chart called a Main Effects Plot that compares each design variable with the overall mean system performance.

This plot indicates that in order to maximize system performance, shown on the vertical axis, the optimized design variable levels are high speed, high mass, elliptical blade geometry, and small blade size. Since the slope of temperature is shallow, I can eliminate it as a major contributor to system performance. Using my optimized design variable settings, I plug the system performance for each into the expected performance equation. This equation predicts the output, which in this case is system performance, when the design variables are set to the desired levels. The expected performance equation indicates that I can expect an increase in system performance from 62% to 73%.
The last step is to run confirmatory tests. Now that I have a number for expected performance, it is necessary (and just common sense!) to prove that the optimized variables will get close to this number. The number of tests is up to your own discretion; I usually run enough so that I’m confident in the result. If the confirmatory tests do not match the expected performance number, the issue is probably either that main factors or noise variables are not accounted for, or that there is a high degree of interaction among main factors.
If more data is required to further optimize results, a full factorial or other type of design could be run with more efficiency due to the knowledge gained from the screening design. In this case, most of the variable settings were either linear or discrete, which means I can rely on the screening design data to choose the optimized variable setting. If I suspected one of the variables was nonlinear, like if the speed variable actually looked like a quadratic function, I would want to describe a more complete model to be sure that my results reflect the actual performance. I might add levels to speed and test against the two successful blade geometries to get a more finely tuned model. This means that my original full factorial experiment is reduced from 192 tests to 3 (levels of speed) x 2 (blade geometries) x 2 (levels of noise variable 1) x 2 (levels of noise variable 2) = 24 tests.
Final Thoughts
Taguchi or not, the key to getting meaningful data out of testing is the old standby: measure twice, cut once. It’s tempting to sprint into the lab, throw something together, and expect things to go a certain way. What usually happens is that you end up wasting half a day figuring out that you need better controls when you could have been spending that time carefully planning out a test plan. What variables do I really care about? What do I want to measure? What is my contingency plan if I don’t get meaningful data? Better yet, once you get a meaningful plan together, get the client to sign off on it so that everyone is on board in terms of expectations, timelines, and program risks. Although screening designs may not be suitable for all situations, when they work they save a huge amount of time, money, and resources.
Resources:
Engineering Statistics Handbook. Ed. Carroll Croarkin and Paul Tobias. 1 June 2003. National Institute of Standards and Technology Information Technology Laboratory SEMATECH. 10 December 2012 .
Stephen R. Schmidt and Robert G. Launsby. 2005. Understanding Industrial Designed Experiments (4th Ed.). Air Academy Press, Colorado Springs, CO, USA.